| Slide 8 | |
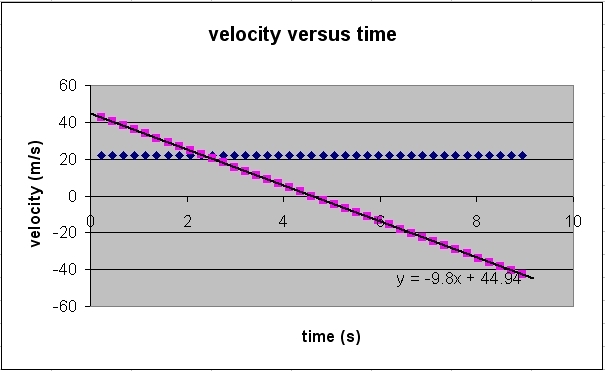
| You have now come
to the last stage of our exercise. The resulting chart now shows the least
square fit for the pink line. The slope of the graph is the acceleration
in the y-direction; ay in
m/s2. We have straight
line fit which tells you that the acceleration is a constant (for the
whole duration of the projectile is in motion) and it is equal to -9.8 m/s2. Vary the values of vo and qo using the ScrollBars and observe the two charts. |
|
 cal2 |
|