| Slide 1 | |
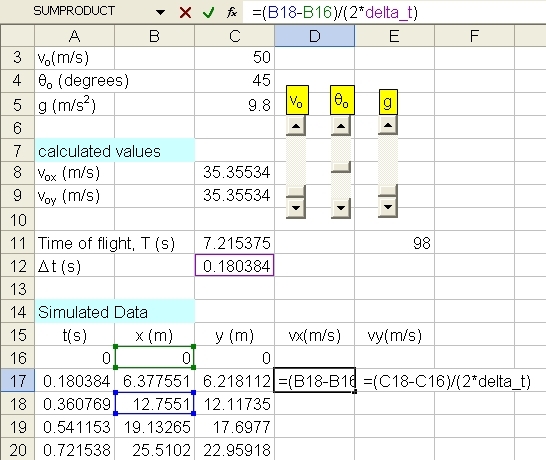
| Our aim now is to
plot a graph of vx versus
t and vy
versus t for the projectile motion data we
have generated with the simulation. We will start with the cell D17 where we need to calculate from data the instantaneous velocity of the projectile at the time step 1. Since our delta_t is sufficiently small, we can approximate the instantaneous velocity to the average velocity in the time interval 2*delta_t with time step 1 in the middle. Remind yourself that this is exactly the definition of the instantaneous velocity as delta_t goes to zero. (Also note that if the acceleration of the motion is a constant, the instantaneous velocity at the middle time of an interval is equal to the average velocity in that interval!). So the velocity in the cell D17 is calculated approximately (from definition) as: =(B18-B16)/(2*delta_t). If you do not understand this part, PLEASE make it clear to yourself by asking your instructor. Enter =(C18-C16)/(2*delta_t) in cell E17 for vy . |
|
 cal1 |
|