OPNET Modeler, the tool we will use in future sessions, is widely used for boosting network R&D productivity, improving product quality and reducing time-to-market of new designs.
The purpose of this session is to make you acquainted with OPNET Modeler, at least with the parts of OPNET Modeler you will be using most frequently. In some parts of this session, questions have to be answered. Compile and hand in your 19 responses to instructor.
To run OPNET, type in the following command: /tools/opnet/8.0.C/sys/unix/bin/opnet &
There are ways to run OPNET on your PC by using Exceed or Distinct Software.
- Online Manuals: choose Online Documentation under Help menu. This will open a browsable .pdf file. You can search the file using the binocular buttons. You can search the index alphabetically for help on certain topics.
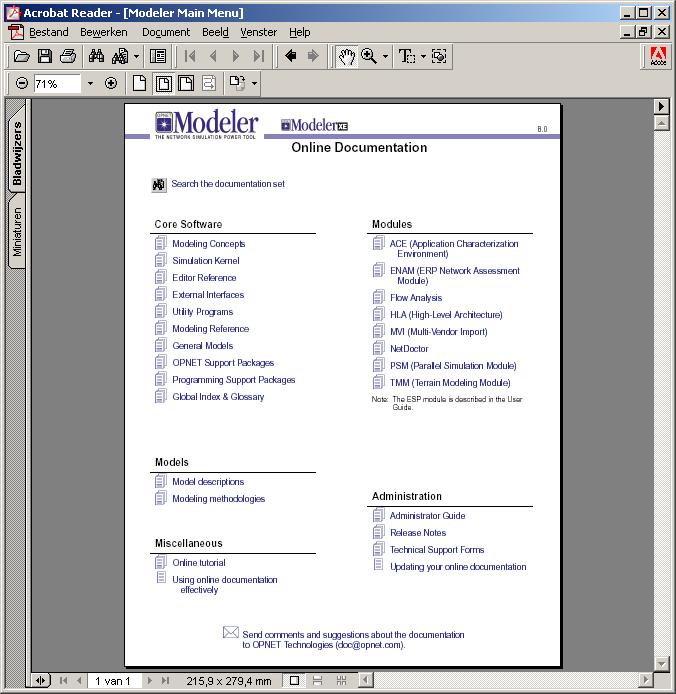
OPNETs Online Documentation
- Online Tutorials: choose Online Tutorials under Help menu. There are some tutorials available online in .pdf format. Running through the Modeler tutorials gives an overview of the features of OPNET Modeler. In case you have some spare time after you completed this session, you can look at these.
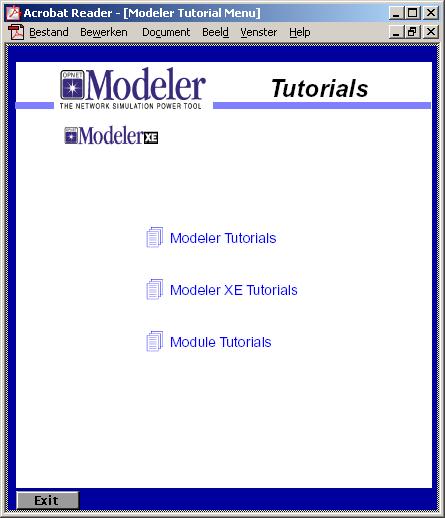
The tutorials
- Model Help: right click on object item and select View Node Description. This will be discussed later on.
- Attribute Help: push detail button in a dialog box. This will also be shown later on.
- Tool Tips: place your cursor over any object and wait for a brief description of that object.
IMPORTANT NOTE: Never contact OPNET directly for whatsoever. If you really need to contact them, please let us know. We will do so for you.
As a small exercise you will now create by yourself a new project focusing on an Office LAN.
Creating a new Project is very easy. Use File, New to create a project and name it start_username. Name the first scenario start1. Include "ethernet_advanced" and "wireless_lan_advanced" as Model Family.
Normally, you should get an empty Workspace and an Object Palette.
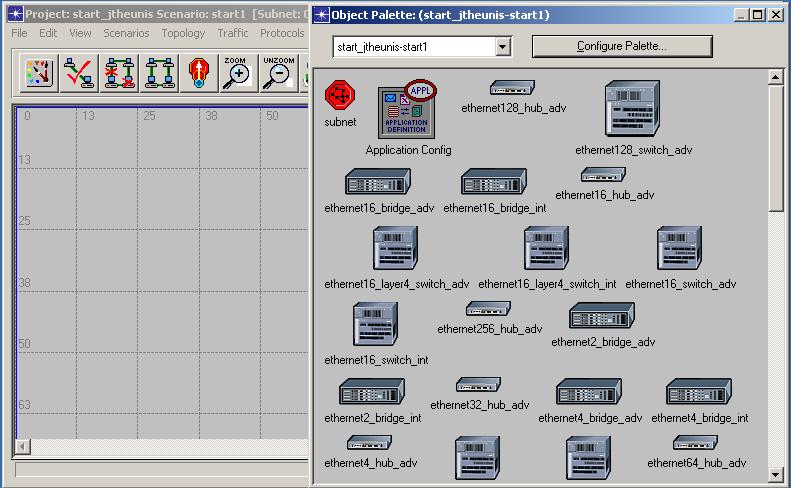
An empty Workspace and an Object Palette

The Object Palette button
You can now copy objects from the Object Palette into the empty Workspace. In case you closed the Object Palette, you can always use the object palette button to revoke it. Create a topology as shown in the figure. Use the advanced models for the ethernet workstations, hubs and switches. Setting the name of the objects is not necessary, although it eases up interpreting results. The objects are linked to the hub with 10BaseT_adv cables, and with 100BaseT_adv cables to the router. The connection between LAN 1 and the switch is 10Mbps.
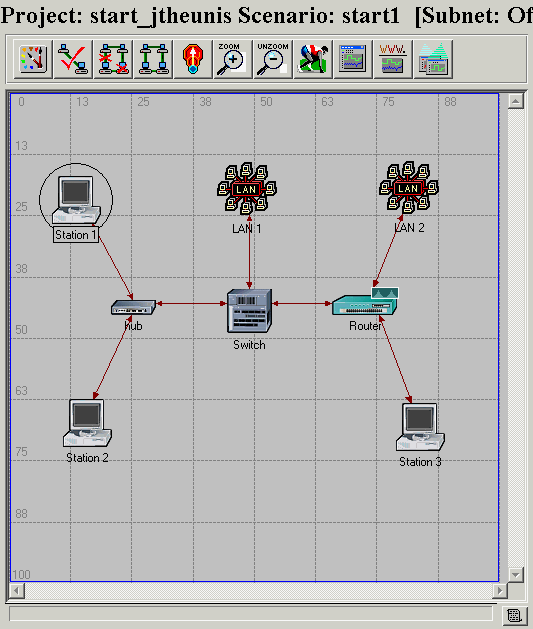
The topology of the network
On the figure, you can see a router, though this device is not included in the Object Palette. Try to include a Cisco router 3000 in the Object Palette yourself (CS_3000_3s_e16_fe2_adv).
Question 1: Explain how you included the router in the Object Palette.
You can get some information about the nodes and links by rightclicking on them and then selecting "View Node Description".
Now you should verify the links you created by pushing the verify links button.

The verify link button
As you can see on the figure below, one link is not properly connected. After replacing this link with a 10Mbps link, everything seems to be alright.
Question 2: What do you think was the problem? What caused it (router, workstation, link or just a human error)?

An erroneous link
NOTE: We will use OPNET Modeler only for network modeling. With the Modeler, you can also model the nodes (e.g. switches, routers, ...) and the processes inside the nodes. As an example, doubleclick on a node. This will show you the node model of the selected object. Doubleclicking on a process in the node models brings up the process model. We won't go any deeper into this. More information can be found in the Online Docs.
If you rightclick on the switch, a menu pops up. Carefully read the options you can choose. Edit the attributes. You will get the table containing the attributes of the switch.
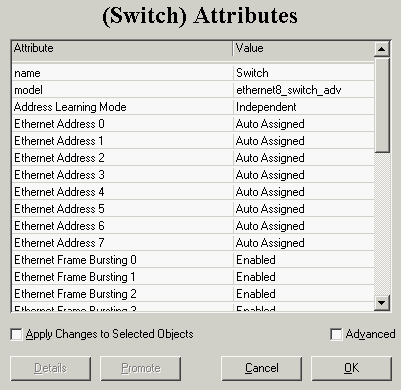
Attributes table of the switch
If you select an attribute, you can get information about it by pushing the details button.
In case you didn't select a 8 port switch, change the model now (ethernetx_switch_adv is the advanced OPNET model of a x port Ethernet switch). Set Ethernet ports 5, 6 and 7 to half duplex.
Question 3: What is the difference between half duplex and full duplex?
Set the Packet Switching Speed to 1,500,000. Then press OK. In the left corner of the Workspace the text "1 object changed" should appear.
Now change the attributes of the three workstations. Try to do this simultaneously. Set the CPU Background Utilisation to the values of the figure given below. After clicking OK, "3 objects changed" should appear.
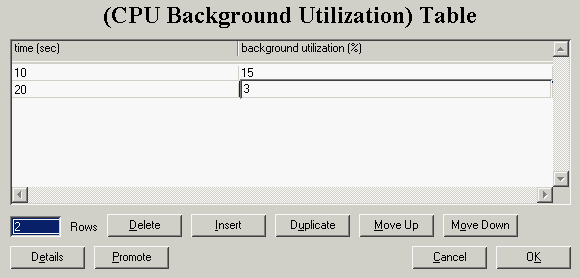
The load of the workstations
Question 4: How did you change the attributes of the three workstations simultaneously?
Set the number of workstations in LAN 1 to 50 and in LAN 2 to 75. You just represented a cluster of 75 PCs by only one node.
First we wil import background traffic. Choose "Export Conversation Pair" from the Traffic menu. We will run a simulation for one hour. Take 10 minutes as Time Step and Mbits/s as Traffic Units. This creates a .txt file you can open in Excel. Set the background traffic from LAN 1 to LAN 2 as in the figure below.
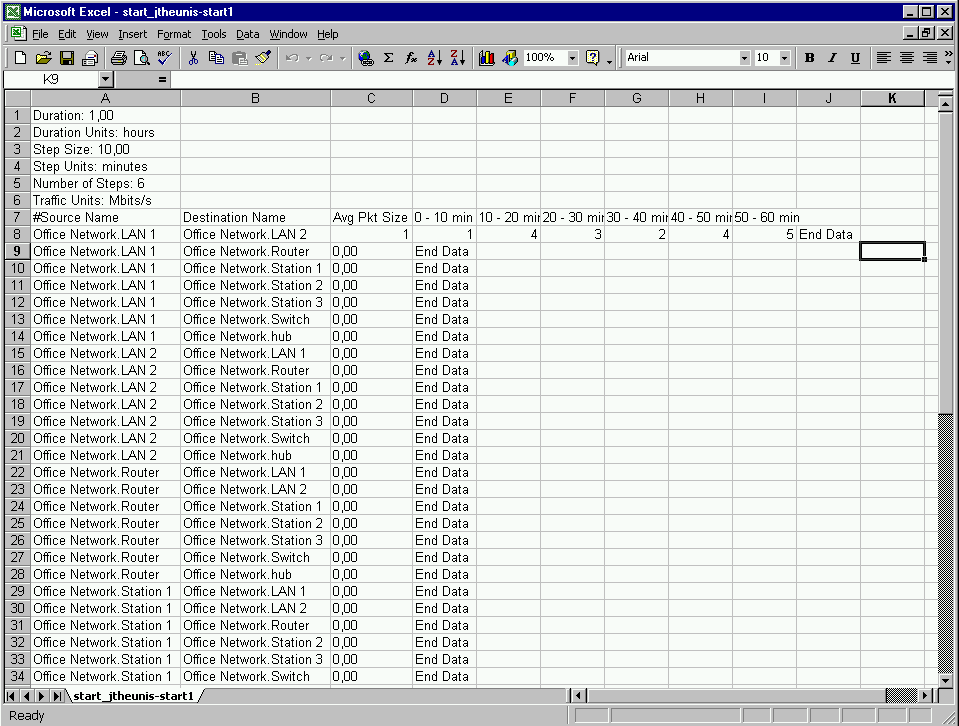
Background traffic
Question 5: Try to set the value of the average packet size to 1000. Will this work? Why (not)?
Now we have to import this background traffic, so choose "Import Conversation Pairs" from the Traffic menu.
Question 6: Also try to import the .txt file with the larger packet size. What is the message you get? Why do you get this message? What do you think is the maximum packet size you are allowed to choose?
You can now look at the background traffic pair you imported with the Conversation Pair Browser. Do you get the same graph as below?
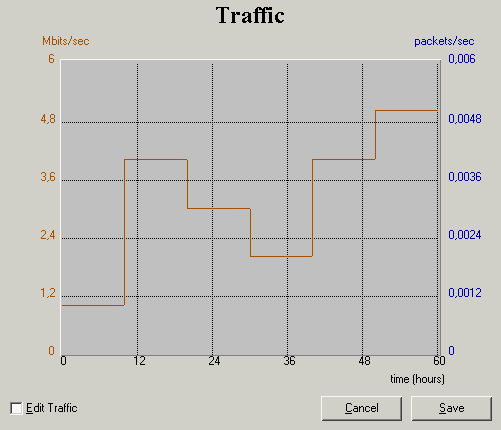
Graph of the imported traffic
Set the LAN Background Utilization to 30% in LAN 1 and to 34 % in LAN 2 (these are attributes).
Until now we only imported background traffic. Now it's time to include some explicit traffic. OPNET Modeler uses a profile and an application to model traffic. With the profile definition you can build the profile of a user. Afterwards, you can assign this profile to e.g. a workstation. In this profile, you can include several applications. This means that a user will run the applications included in the user profile.
In OPNET you can use some predefined tasks (e.g. Http, ftp, ...) to construct your application. You can also build a task yourself. In this session, we will do both.
We will build a custom task first. Drag a Task Definition from the Object Palette into the Workspace.

A Task Definition
Edit the attributes and specify the task. Name the task Custom and configure it as in the figure below.
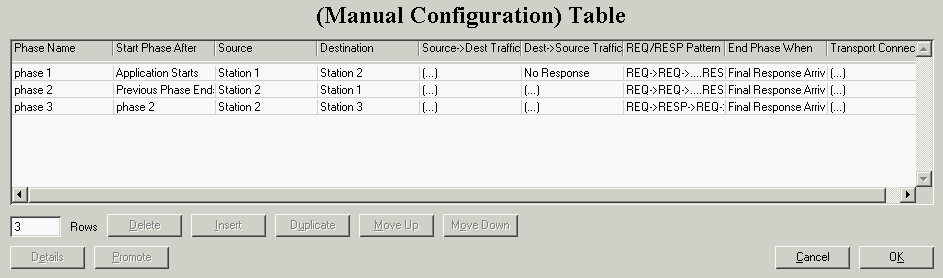
The configuration of the custom task
Set the interresponse time of Dest->Source Traffic to poisson(2).
Question 7: Will traffic behave differently if we would have chosen exponential(2)? If yes: why? If no: what would be the difference? Are most interarrival times exponentially or poisson distributed?
Question 8: Describe the task you just defined. What will happen when the task starts?
Click OK till you exit the attributes of the task definition. Now insert an Application Definition and edit the attributes.

An Application Definition
Edit the Application Definitions as below.
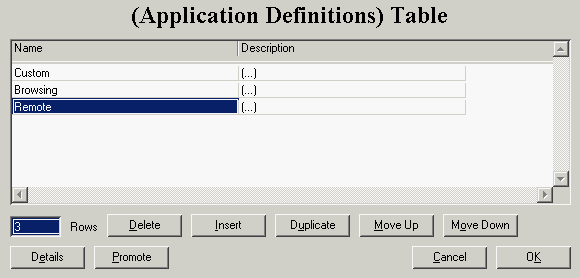
The Application Definitions Table
Try to insert the custom task you defined before in the custom application definition. Choose "Http, Heavy Browsing" for the browsing application and "Remote Login, Medium Load" for the remote application.
Now we will build a profile. Insert a Profile Definition from the Object Palette and edit its attributes.

A Profile Definition
Edit the Profile Configuration table as below.
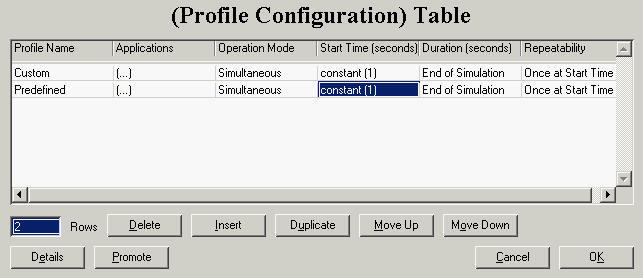
The Profile Configuration Table
Question 9: Suppose we didn't choose Simultaneous as Operation Mode, but Serial. What would be the difference? What is the difference between Serial (Random) and (Ordered)?
Choose the custom application for the custom profile and the browsing and remote applications for the predefined profile.
Now we have to set which nodes in the network are using the profiles we created. Therefore, you have to edit the attributes of some nodes. Let all three workstations support both profiles.
Now you have defined traffic, both background and explicit, on your network.
There are some ways for selecting statistics. We will list and comment them briefly.
- In the Simulation menu, you can choose "Choose Individual Statistics". There is a difference between a global, a node, and a link statistic. Here you can select them all. We will only select global statistics here. Select Custom Application Traffic Received and Sent (packets/sec), Ethernet Delay, HTTP Traffic Received and Sent (packets/sec), and Remote Login Response Time, Traffic Received and Sent (bytes/sec).
- If you rightclick on an empty space in the Workspace, you can also select "Choose Individual Statistics". Actually, this brings up the same menu as above.
- Rightclicking a node, you can select "Choose Individual Statistics". Do so for the router. Select the Traffic Dropped, Forwarded, and Received (packets/sec). For the three workstations, select the same node statistics as you selected for the global statistics above.
- Rightclicking a link allows you to select statistics for the link. Record the troughput and utilisation for some links.
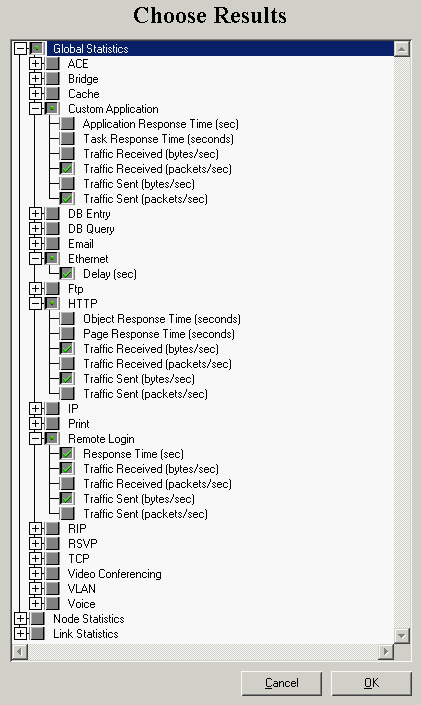
The selected global statistics
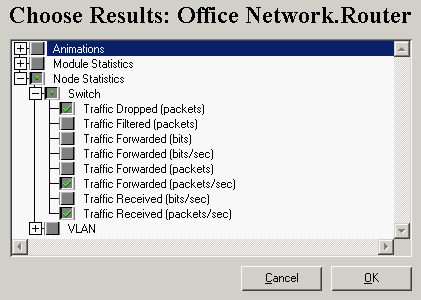
The selected router statistics
Question 10: What is the difference between a global, a node, and a link statistic?

The Run Simulation button
Normally the Configure Simulation window pops up.
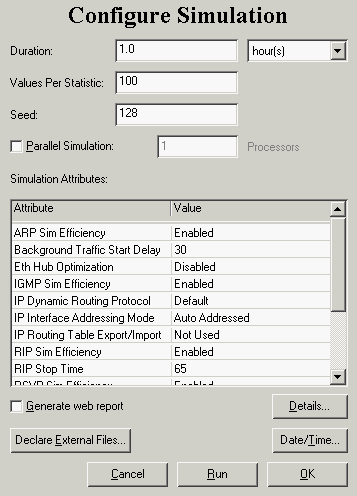
The Configure Simulation window
Question 11: What is the function of the Seed? Does the value of the Seed influence the simulation?
Click the Run button. After a short time, the simulation will be complete. Investigate the output in the Simulation Sequence window. You see only 525 events occurred (according to the settings you defined, this can be a bit more or less). This is definitely is not enough. It is also indicated that there are 12 entries in the Simulation Log. Let's investigate this log (Results, Open Simulation Log).
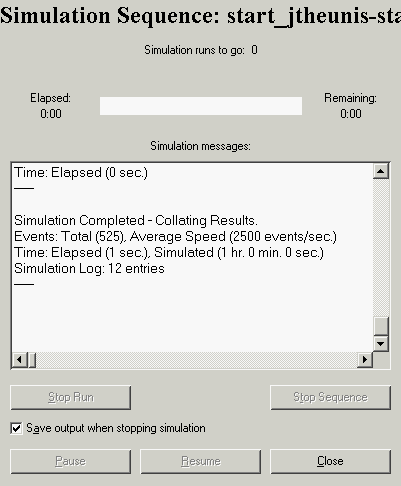
The simulation is complete
If you click on a warning concerning HTTP, you get a short explanation of the warning, a reason for the warning, and a suggestion for solving the problem.
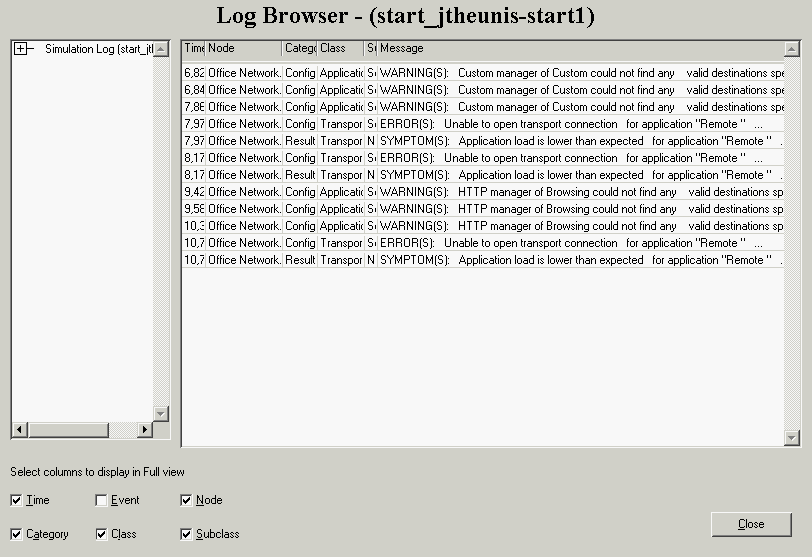
The Simulation Log
The reason of the warning is obvious: we wanted users to browse, but didn't include a HTTP server. Add a server to your topology. Connect it to the router. Set its name to "HTTP Server", and let it support all services. Rerun your simulation. Normally the HTTP warnings should have disappeared from the Simulation Log.
Question 12: Other warnings vanished as well from the Simulation Log. Which ones? Why?
Another warning you might receive concerns background traffic.
Question 13: Which warning do you get? How to solve it?
Some warnings remain in the Simulation Log. These will be handled later on.
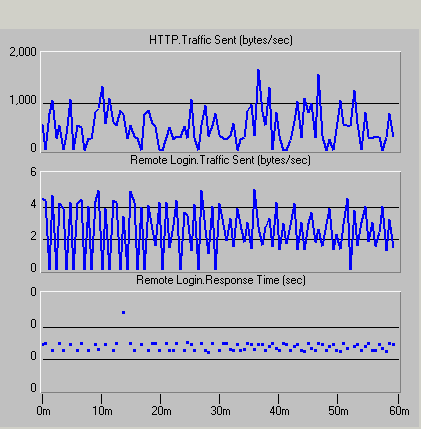
Some results
Question 14: Do you get similar results? If not, why?
Question 15: What is the average value of the Remote Login Response Time (as accurate as you can get it)? How did you obtain this value?
Now take a look at the Global Statistics of the Custom Application. Oops, you didn't get any results. What went wrong? The answer can be found (partly) in the Simulation Log. Get rid of all warnings concerning the custom application.
NOTE: It will take some time to solve all custom application problems. Please try to do this yourself. If you see no light anymore in the darkness of troubles, ask an assistent for help.
HINTS:
- Replace Station 2 by a server.
- You will need to edit Source Preferences, Destination Preferences, Server Address, ...
- ALWAYS read the warnings in the Simulation Log. They are very helpful.
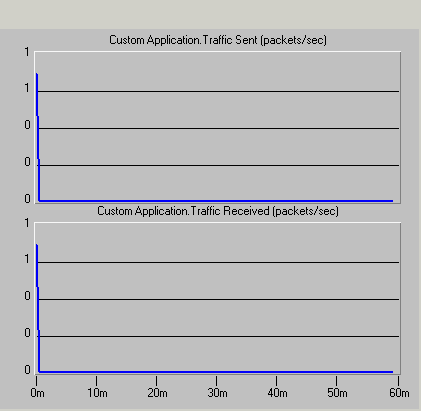
The results from the Custom Application
This is because of the definition of the profile. Try to adjust it so that you get traffic every 30 seconds (exponentially distributed). Also adapt the Predefined profile.
Take another look at the results of the Custom Application. Pay special attention to the values in packets/sec.
Question 16: Do you expect this values? If not, what is the problem? (HINT: change the number of Values per Statistic to 1000 in the Configure Simulation window and run the simulation again. Compare results.)
There are still some warnings left in the Simulation Log.
Question 17: How can you avoid these warnings? Are they critical?
We don't want to throw away the results and the configuration of the previous simulation. Therefore, we will create a new scenario. Because we will adapt the existing configuration, the best thing to do is to duplicate the scenario. Name the new scenario "start2".
Now let all users in both LANs participate in the Predefined profile. Simulate and compare the obtained results with the ones from the previous scenario.
Question 18: Are you able to get a comparison as in the figure below? How?
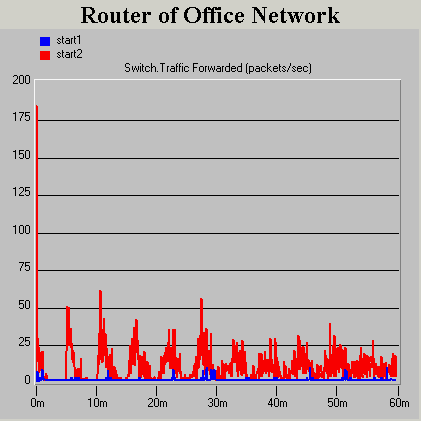
A comparison of results from both scenarios
You can play a bit with the settings and add a number of clients if you'd like to. For those who are interested: try to overload some links or servers by adding traffic and/or users. Create a new scenario for doing this.
- When publishing results, it is sometimes better to overlay statistics (instead of stacking them) or to choose another filter than "As Is".
- You can add different statistics on one plot using the add button in the View Results window. Click the button and then click on the desired panel. The selected statistic will be added on the panel. Try this out with your results.
- You can configure the appearance of graphs, by either rightclicking the graph itself (allows you to change Color, Draw Style, Grid Properties and so on) or rightclicking the gray border around the graph (allows you to change PAnel Title, Background Color and so on).
- You can find bottlenecks using Results, Find Top Results, which shows you the highest or lowest values of a statistic.
- You can also generate a Web Report. Click the Run Simulation button and select "Generate Web Report". After simulating, you can look at it using Results, Statistic Reports, Launch Last Report. Try this out.
- VoIP: Add a profile that includes IP Telephony (use the predefined application of OPNET Modeler for doing so). First let Station 1, 2, and 3 use VoIP. Afterwards allow the LAN users to use VoIP.
- Wireless LAN: Replace Station 1 and 3 by wireless clients. Add some more clients in another scenario, running both profiles.
- Video: Add a profile that includes High Resolution Video (use the predefined application of OPNET Modeler for doing so). Investigate the needed parameters of this application. First let Station 1, 2, and 3 use Video. Afterwards allow the LAN users to use Video.
Compile all of your 19 answers and hand them to instructor.