Brief Description & Case Study:
In order to ease the implementation of the algorithms of throughput and delay analysis for any given generic network of interest, an analytical simulator has been developed. We have made the simulator publicly available to improve and ease the process of deploying VoIP for network designers and planners. The simulators engine implements the analytical approach of throughput and delay analysis described in [12]. The simulator is GUI-based with drag-and-drop feature to build any generic network topology. In order to accomplish this, the simulator has been developed in C# programming language on top of the open source diagramming tool known as the Netron Core available at http://www.orbifold.net/netron. The classes in Netron Core are easily extendable through inheritance. Many different applications can be developed on top of the Netron Core and the code can be re-used in different contexts. For our case many features have been added particularly for building network topology. As the network topology is constructed, objects such as nodes, links, call paths, as well as call distributions are stored in hash tables. Hash tables are used for fast access as we need to lookup for nodes and links frequently in our algorithm. The simulator has the essential File, Edit, View, and drawing options. Figure 1 shows the main user interface of the VoIP tool. It has two tabbed panes: left pane and the right pane.
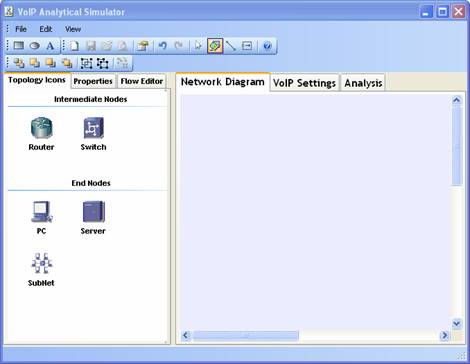
Figure 1. Interface of VoIP Analytical Simulator
1.1 The left pane
The left pane has three tabs, namely Topology Icons, Properties and Flow Editor, as depicted in Figure 2. Figure 1 shows the Topology Icons tab which has all the node icons used to build the desired network topology. The network topology icons that simulator has currently Switch, Router, PC, Server and Subnet. The network topology is built by dragging and dropping the required shape on to the stage. The stage is located on the Network Diagram tab of the right pane. Once the network icons are placed on the stage, they can be connected by selecting the link or line icon shown on the top main menu bar of the simulator.
Figure 2(a) shows the Properties tab which is used to specify the properties of the network elements of nodes, links, and subnets (such as name, bandwidth or capacity, location, width, height and the background traffic. Properties for different network elements can be selected by simply clicking on the desired network icon of the network topology. Each network element has different network properties with default values. For topology icons, users can change their sizes and locations by changing their width and height fields in their respective property window. Figure 2(a) shows the properties of a link which shows not only the capacity of the link, but also the background traffic in both Mbps and pps.
Figure 2(b) shows the Flow Editor tab which is used to define the VoIP flows or paths of calls in the network. A new flow can be added by clicking first Add New button and then entering a flow name. Next, to specify the path of the flow, the Select button must be clicked. Then the path details are simply inserted hop-by-hop by going to the network topology already drawn on the Network Diagram of the right pane, and hitting the network elements one-by-one. The constructed flow is bidirectional. The percentage of the total calls passing through this path is specified in the Call Distribution (%) field. The user has to click on Save when done adding the flow. For example, Figure 2(b) shows the path details and percentage of a flow named F1C1-VoIP Gateway established from a node on Floor 1 to a VoIP gateway node passing through elements of switches and routers. Once Save is clicked, this follow will appear in the list of Stored Flows. The total call distribution of all flows must not exceed 100%.
|
|
|
|
(a) |
(b) |
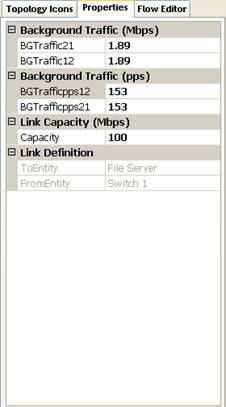
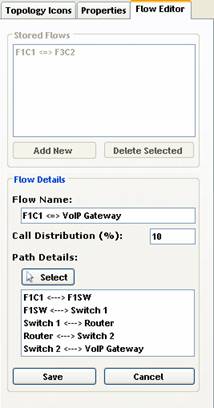
Figure 2. Properties of network elements (a) and Flow Editor of VoIP flows (b)
1.2 The right pane
The right pane also has three tabs namely, Network Diagram, VoIP Settings and Analysis. Figure 1 shows the Network Diagram pane which is the stage for building the topology. Any generic network topology can be built by simply dragging an dropping networking elements of Topology Icons into the stage and connecting them through links. Links can be selected from the top main menu bar of the simulator. Figure 3(a) shows the default VoIP settings according to ITU G.711u standards, specifically for bandwidth, packet size and end-to-end latency. The users can restore or change these settings. VoIP Settings window allows the users to set the future growth percentage of each network element, as well as breaking the 150ms end-to-end delay into three separate delays of sender, receiver, and network. Results can be obtained through the Analysis tab shown in Figure 3(b). Before obtaining the results, the user can verify the models via Verify Model option to check for any errors in settings or configuration. Errors may include missing links or flows in the network topology or missing configuration. There are two different analytical reports showing the number of calls that can be supported. One report is based on the throughput analysis and the other is based on delay analysis. The details of these reports will be discussed next in Section 3.3.
|
|
|
|
(a) |
(b) |
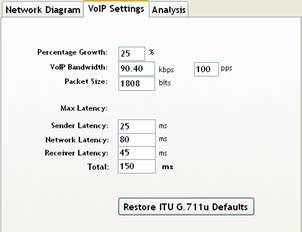
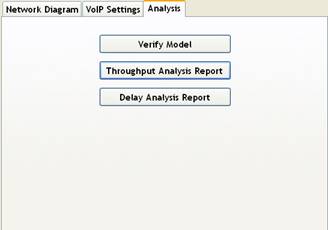
Figure 3. VoIP Settings (a) and verifications and reports (b)
In order to illustrate the simulators options further we give an example. Figure 4 illustrates a typical network topology of a small enterprise residing in a high-rise building. The enterprise has a network of three floors or departments. The network shows the VoIP nodes of an H.323 gatekeeper and gateway. The gatekeeper node handles signaling for establishing, terminating, and authorizing connections of voice calls. The VoIP gateway is responsible for converting VoIP calls to/from the Public Switched Telephone Network (PSTN). Other hardware requirements include a VoIP client terminal, which can be a separate VoIP device, i.e., IP phones, or a typical PC or workstation that is VoIP-enabled. This topology was also reported in [11,12] and used here for validation and comparison purposes. We will also use the same parameter values for background traffic, traffic flow, and call distribution as those reported in [11,12]. According to [18,19], the capacity for the assumed model router and switch, is 25,000pps and 1.3M pps, respectively. All links are switched full-duplex Fast (100Mbps) Ethernet.
Figure 4. Network topology with VoIP Components
Figure 5 shows the corresponding network model constructed by the VoIP Simulator for the network topology of Figure 4. In order to avoid having numerous PC nodes or IP phones per floor representing end-users (and therefore clutter the network topology diagram), Floor LANs have been simply modeled as a LAN that enclose an Ethernet switch and three designated Ethernet PCs used to model the activities of the LAN users. For example, Floor 1 has three nodes (labeled as F1_C1, F1_C2, and F1_C3). F1_C1 is a source for sending voice calls. F1_C2 is a sink for receiving voice calls. F1_C3 is a sink and source of background traffic. This model allows for generating background traffic and also establishing intra-floor calls or paths from F1_C1 and F1_C2, and passing through the floor switch of F1SW. The sending and sinking PC nodes of VoIP (e.g., F1_C1 and F1_C2)have infinite capacity and there is no limit on how many calls can be added or received by them. We ignore the signaling traffic generated by the gatekeeper. We base our analysis and design on the worst-case scenario for VoIP call traffic. The signaling traffic involving the gatekeeper is only generated prior to the establishment of the voice call and when the call is finished. This traffic is relatively limited and small compared to the actual voice call traffic. In general, the gatekeeper generates no signaling traffic throughout the duration of the VoIP call for an already established on-going call.
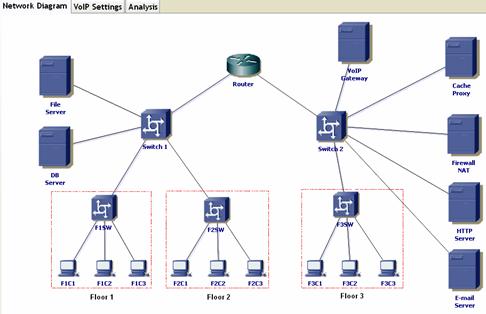
Figure 5. Corresponding network diagram constructed by analytical simulator
Figure 6 shows the reports of throughput and delay analyses. Figure 6(a) reports the number of calls that can be supported based on bandwidth analysis. A total of 315 calls can be supported for the whole network. In order to identify possible bottlenecks, the report also shows individual calls that can be supported per node and per link. It is shown that the router is the bottleneck, and supporting calls more than 315 calls would require definitely a replacement for the router. Figure 6(b) reports the number of calls that can be supported based on network analysis. A total of 313 calls can be supported such that the network delay of any of the specified VoIP flows does not exceed the required 80 ms. The figure shows that with 313 calls, a network delay of 16.76 ms will be introduced. This means when adding one more call, the network delay of a maximum of 80 ms was exceeded. The report of Figure 6(b) also exhibits the network delay per flow or path. In our example, there were a total of nine VoIP flows. As shown, the first triple is for intra-floor flows. The second triple is for inter-floor flows. And the third triple is for external flows. Such information gives insight on the source of the delays as well as the path that causing most of the delays. As the figure shows, the inter-floor flows of F1C1-F3C2 and F2C1-F3C2 experience the largest delays, as they pass through the router.
Therefore, it can be concluded that the network can support up to 313 calls with end-to-end delay of 16.76 ms. The network delay (for this particular network topology) is the more dominant factor (than throughput) in determining the number of voice calls to be supported. This is consistent with results obtained using MATLAB-based analysis and OPNET-based simulation in [11,12].
|
|
|
|
(a) |
(b) |
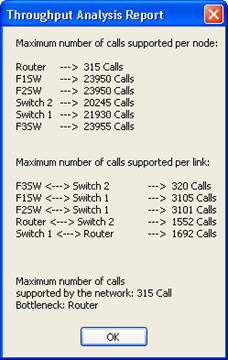
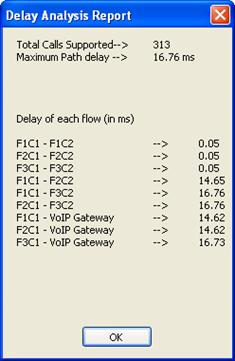
Figure 6. Throughput Analysis Report (a) and Delay Analysis Report (b)
References
[1] M. Bearden, L. Denby, B. Karacali, J. Meloche, and D. T. Stott, Assessing Network Readiness for IP Telephony, Proceedings of IEEE International Conference on Communications, ICC02, vol.4, 2002, pp. 2568-2572
[2] B. Karacali, L. Denby, and J. Melche, Scalable Network Assessment for IP Telephony, Proceedings of IEEE International Conference on Communications (ICC04), Paris, June 2004, pp. 1505-1511.
[3] Eurescom, H.323 Studies, http://www.eurescom.de/~public-webspace/P800-series/P807/start/printerversion.asp
[4] NetIQ, Vivinet Assessor, http://www.netiq.com
[5] BMCsoftware, PATROL DashBoard, http://www.bmc.com
[6] Radvision, H.323 Protocol Toolkit, http://www.radvision.com
[7] Omegon, White Paper: NetAlly, http://www.omegon.com/
[8] Lucent Technologies, VitalSuite, http://www.qip.lucent.com
[9] VideNet Scout Resources, http://scout.video.unc.edu
[10] P. Calyam, W. Mandrawa, M. Sridharan, A. Khan, P. Schopis, H.323 Beacon: An H.323 application related end-to-end performance troubleshooting tool, ACM SIGCOMM 2004 Workshop on Network Troubleshooting (NetTs), 2004.
[11] K. Salah and A. Alkhoraidly, An OPNET-based Simulation Approach for Deploying VoIP, International Journal of Network Management, John Wiley, Vol. 16(3-4) (2006, pp. 159-183.
[12] K. Salah, On the Deployment of VoIP in Ethernet Networks: Methodology and Case Study, International Journal of Computer Communications, Elsevier Science, Vol. 29(8) (2006), pp. 1039-1054.
[13] Salah, K., and Almashari, M., An Analytical Tool to Assess Readiness of Existing Networks for Deploying IP Telephony, Proceeding of 11th IEEE Symposium on Computers and Communications, IEEE ISCC 2006, Sardinia, Italy, June 27-30, 2006, pp. 302-305
[14] Recommendation H.323, Packet-based Multimedia Communication Systems, ITU, 1997.
[15] Recommendation G.114, One-Way Transmission Time, ITU, 1996.
[16] ITU-T Recommendation P.800, Methods for subjective determination of transmission quality, www.itu.in/publications/main_publ/itut.html
[17] R. Ahuja, T. Magnanti, and J. Orlin. Network Flows. Prentice Hall, Englewood Cliffs NJ, 1993.
[18] Cisco Systems Inc., Cisco 2621 Modular Access Router Security Policy, 2001, http://www.cisco.com/univercd/cc/td/doc/product/access/acs_mod/cis2600/secure/2621rect.pdf
[19] 3Com, 3Com Networking Product Guide, April 2004, http://www.3com.co.kr/products/pdf/productguide.pdf