INTRODUCTION
Definition
of Electrodeposition:
Electrodeposition is an
electrochemical process by which metal is deposited on a substrate by passing a
current through a conductive bath.
Objective of Electrodeposition:
Objects are electroplated to prevent corrosion, to obtain a hard surface or attractive finish, to purify metals (as in the electro refining of copper), to separate metals for quantitative analysis, or, as in electrotyping, to reproduce a form from a mold. Cadmium, chromium, copper, gold, nickel, silver, and tin are the metals most often used in plating (2).
Electroplating
is an oxidation-reduction reaction, where one material gives up electrons (gets
oxidized) and the other material gains electrons (gets reduced). The anode is
the electrode at which oxidation occurs, and the cathode is the electrode at
which reduction occurs (2)
The process of metal deposition generally
consists of several partial processes:
1‑Transport of ions to be deposited from the
bulk of the solution to the cathode surface through migration and diffusion.
2‑Charge transfer
reaction: the simple metallic Ions are then discharged at the electric double
layer.
3‑Electrocrystallization
process: the discharged metal atoms are then changed into crystalline state (3).
The electroplating process
was found to depend on a great number of factors affecting
the nature and properties of deposits, among these factors are current density,
conductivity of the solution, presence of addition agents, agitation,
temperature and the nature of the base metal (substrate).
Heterogeneous
or cluster-based alloys have recently prompted many investigations due to their
interesting magnetic properties (1).
Because copper is highly electropositive
(noble) character, copper is easily precipitated by metals lower in the
electrochemical series such as iron or zinc.
One
advantage of iron deposits is that they are soft enough to be machined or
otherwise finished, after which they can be casehardened.
The electrodeposition of Cu-Fe alloy is one of the best known examples of
anomaly codeposition, in which the electrochemically less noble metal deposits
preferentially.
The ratio of the weight of metal actually deposited to that, which would have resulted if all the current had been used for deposition, is called the cathode current efficiency with respect to metal deposition.
It is 100% when as much metal is deposited or dissolved, respectively, as would be expected on the basis of Faraday’s Law (3).
When no external potential is applied to the electrolytic
cell of similar cathode and anode, the potentials of the anode and cathode are
equal, at least within a fraction of a millivolt. If the electrodes are
connected externally, no current flows. To produce a current, an external
potential must be furnished, this potential is called polarization.
At each electrode of the unpolarized cell, anodic and
cathodic reactions proceed at equal rates. So that, there is no net change from
these exchange currents. Application of the polarizing potential lowers the
potential at the cathode, thus accelerating the deposition reaction and
retarding the dissolution reaction (anodic reaction). This result in a net
cathodic current and corresponding deposition of metal.
At the anode the potential is raised with the opposite consequences. The
shift in potential at either electrode is its polarization, overpotential, or
overvoltage.
Plating is governed by Faraday's Laws that state:
1. The
weight of a substance formed at an electrode is proportional to the amount of
current passed through the cell (at certain limit).
2.
Weights of different
substances produced at an electrode by the same amount of current are
proportional to their equivalent weights (2).
The cathodic current efficiency (F%) was
calculated simply according to Faraday’s laws from the relation,
F
% = W/Wt x 100
Where (W) is the experimental weight of the deposit and (Wt)
is the theoretical weight of the deposit.
The theoretical weight of the individual metal
deposited can be calculated as follows:
![]()
Where (Q = I x t) is the amount of electricity passed through the cell and expressed in ampere second and Faraday’s constant is 96485.
The partial current efficiencies of the parent
metals in the alloy F1 % and F2 % were determined from the
relations:
F1 % = W1 /Wt
x 100
F2 % = W2/Wt
X 100
The total efficiency of the
alloy F1 % is equal to the sum of the partial current efficiencies F1%
and F2 %.
Ft%= F1%
+ F2%
The
composition of the alloy was determined by chemical analysis for the alloy
deposit using Inductively Coupled Plasma (ICP) Atomic
Emission Spectrometry (ICP‑AES), Model Plasma 400, after dissolving the
deposited alloy in diluted aqua regia (3FICL: 1HN03) diluted 50% with
distilled water (3).
All
Experiments were carried out at room temperature (23
±
2 oC).
Electroplating
Bath (cell):
Electroplating
is performed in a plating bath, which is usually a non-metallic tank (usually
plastic). The tank is filled with electrolyte that has the metal, to be plated,
in ionic form. See Tables 1 and 2.
Anodes:
The anodes used were made from pure platinum
sheet. Those anodes were cleaned with hot concentrated nitric acid solution,
washed with distilled water and finally were rinsed with the electrolyte being
used.
The anode is connected to the
positive terminal of the power supply.
The cathodes used were made from steel sheet
(0‑6 mm thickness) of compositions (0.05 C %, 0.01 S
%,
0.01 P %, 0.23 Mn %, 0.03 Ni % 0.02 Cr %, 0.04 Cu %, 0.002 Ti %, 0.003
As %, 0.003 Sn %, 0.03 Al %, 0.004 Mg %, 0.002 Zn % and 99.55 Fe %). Before each
run, the cathodes were mechanically polished with emery paper, washed with
distilled water, rinsed with acetone, dried, weighed and dipped in the electro
plating cell.
The cathode is the work piece,
the substrate to be plated. This is connected to the negative terminal of the
power supply. The power supply is well regulated to minimize ripples as well to
deliver a steady
predictable
current, under varying loads such as those found in plating tanks.
The electrical circuit shown
diagrammatically in Fig. 1 was used. It consists of the electroplating cell in
which the steel cathode was inserted with the Pt anode their dimensions 3.2 cm x
2 cm (6.4 cm2 area) and fixed in their appropriate positions. Those
two electrodes were connected to a potentiostat type EG & G Model 273A,
which was connected to a computer, see Fig.1.
As
the current is applied, positive metal ions from the solution are attracted to
the negatively charged cathode and deposit on the cathode. As replenishment for
these deposited ions, the metal from the anode is dissolved and goes into the
solution and balances the ionic potential.
Table-1 Composition of Cu-Fe
Platting baths:
|
Bath symbol |
Cupric Acetate (g/L) |
Ferrous Sulphate (g/L) |
Tri-Sodium Citrate (g/L) |
|
(Cu-Fe)-1 (Cu-Fe)-2 (Cu-Fe)-3 (Cu-Fe)-4 (Cu-Fe)-5 (Cu-Fe)-6 |
10 25 25 25 25 25 |
2 2 1 1 1 10 |
50 50 20 70 50 50 |
All
these baths at constant:
Time:
t=10 min
Current:
I=0.1 A
Table-2 Composition of Cu-Fe Platting baths at different Current Density
and Time:
|
Bath symbol |
Current Density (A) |
Time (min) |
|
(Cu-Fe)-7 (Cu-Fe)-8 (Cu-Fe)-9
(Cu-Fe)-10 (Cu-Fe)-11 (Cu-Fe)-12 |
0.1 0.3 0.5 0.7 0.2 0.2 |
10 10 10 10 5 50 |
All these baths at constant:
[Cu]=25 g/l
[Fe]=1 g/l
[Na]=70 g/l
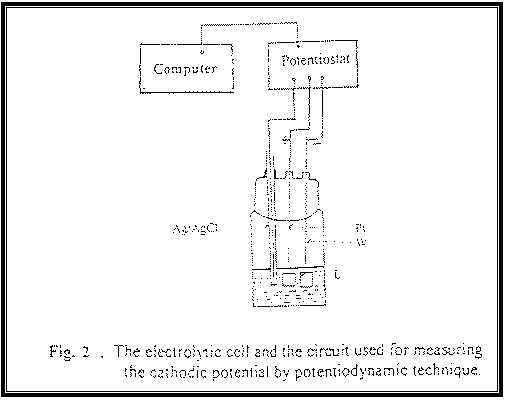 |
In this techniques before each experiment, the
electrolytic cell (L) shown in Fig. 2 was cleaned, washed and filled with the
test plating solution to the desired level to ensure complete submerge of the
electrodes. Then the cleaned electrodes were placed in their respective
positions. The potentiodynamic polarization curves were measured under different
conditions. The curves were swept from the rest electrode potential (at zero
current potential) towards less noble values at scan rate of 1 mV/s.
The potentiodynamic cathodic polarization measurements
were carried out using a steel (working) electrode and platinum (counter)
electrode. Each had an area of 1cm2. All cathodic potentials were
measured relative to an Ag/AgCl saturated reference electrode using the
potentiostat/galvanostat connected with a PS computer. All experiments were
performed at 25 ± 2 C. See
table-3.
Table-3 Composition of Cu-Fe
baths of Cathodic Polarization Curves:
|
Bath
symbol |
Cupric
Acetate (g/L) |
Ferrous
Sulphate (g/L) |
Tri-Sodium
Citrate (g/L) |
pH |
|
Fe-1
Fe-2
Fe-3
Fe-4
Cu-1
Cu-2
Cu-3
Na-1
Na-2
Fe-Na
Cu-Na
Fe-Cu-Na
|
25
25
25
25
10
15
20
25
25
---
20
20
|
1
2
5
10
2
2
2
1
1
2
---
2
|
50
50
50
50
50
50
50
20
70
50
50
50
|
5.4
5.6
5.5
5.1
5.9
5.6
5.5
5.5
5.7
7.6
5.8
5.6 |
RESULTS
AND DISCUSSION
PART
I: Cathodic Current Efficiency
1.
Effect of Copper:
|
Con(g/l) |
%
F |
|
10 |
46.9 |
|
25 |
92.0 |
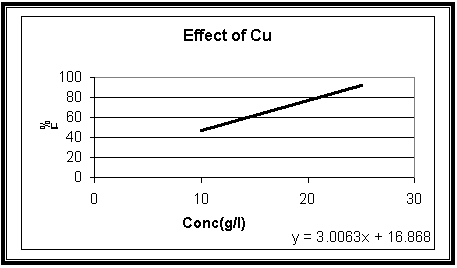 |
Fig.4
Effect of copper
(Cu) concentration on the cathodic current efficiency of (Cu-Fe)
electrodeposition with constant Sodium Citrate and iron concentrations 50 and 2
gL-1 at
23 oC, t = 10 min and I = 100 mA
2.
Effect of Tri-Sodium Citrate:
|
Con(g/l) |
%
F |
|
20 |
82.1 |
|
70 |
88.3 |
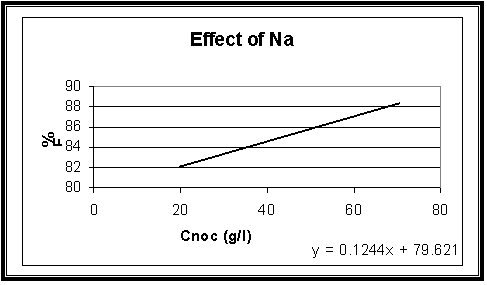 |
Fig.5
Effect
of Sodium Citrate concentration on the cathodic current efficiency of (Cu-Fe)
electrodeposition with constant Copper and iron concentrations 20 and 1 gL-1
at 23 oC, t = 10 min and I = 100 mA
3.
Effect of Iron:
|
Con(g/l) |
%
F |
|
1 |
75.4 |
|
10 |
80.6 |
Fig.6
Effect of iron
(Fe) concentration on the cathodic current efficiency of (Cu-Fe)
electrodeposition with constant Sodium Citrate and copper concentrations 50 and
25 gL-1 at 23 oC, t = 10 min and I = 100 mA
4.
Effect of Current Density:
|
Current
density (mA cm-2) |
Total
% F |
|
0.016 |
94.2 |
|
0.047 |
176.5 |
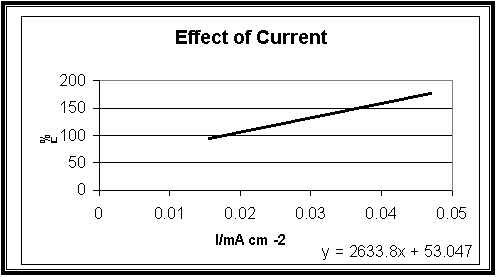 |
Fig.7
Effect
of Current density on the cathodic current efficiency of (Cu-Fe)
electrodeposition with constant Copper, Sodium Citrate and iron concentrations
25, 70 and 1 gL-1 at 23 oC, t = 10 min
5.
Effect of Time:
|
t(min) |
Total%
F |
|
5 |
55.6 |
|
50 |
190.6 |
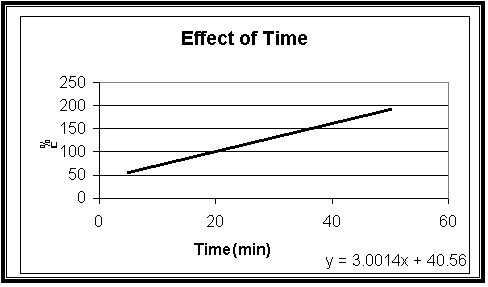 |
Fig.8
Effect of time
on the cathodic current efficiency of (Cu-Fe) electrodeposition with constant
Sodium Citrate, iron and copper concentrations 70, 1 and 25 gL-1 at
23 oC, t = 10 min and I = 200 mA
Cathodic
Current Efficiency Discussion:
Fig-4 shows that the cathodic current efficiency, F% increase with increasing the concentration of Cu2+ ions. This could be attributed to the fact that increasing Cu2+ ions content in the bath result due to a decrease in the Cu2+ deposition in the diffusion layer and consequently decreases the concentration (diffusion) over potential.
Fig-5 shows that the cathodic current efficiency, F% increase with increasing the concentration of Sodium Citrate. This indicates that the more acidic bath increase efficiency.
Fig-6 shows that the cathodic current efficiency, F% increase with increasing the concentration of iron.
Fig-7 illustrates the influence of increasing the deposition current density on the values of F%. The data show that the efficacy increases with increasing currant density.
Fig-8 shows that the cathodic current efficiency, F% increase with increasing the period of the time. This indicates that the more time result in increase the efficiency.
According to the data, promising solution to be selected as an optimum path for further investigation contains:
25 gL-1 Cupric Acetate and 50 gL-1 Tri-Sodium Citrate and 2 gL-1 Iron, bath (Cu-Fe)-2 and the operating values were T at 23 oC, t = 10 min and I = 100 mA.
The optimum path for vary the current density and the time:
(Cu-Fe)-10, which operate at current I=700mA and time t=10min at constant [Cu]=25 gL-1, [Fe]=2 gL-1 and [Na]=50 gL-1
PART
II: Cathodic Polarization Curves:
1.
Effect of Iron:
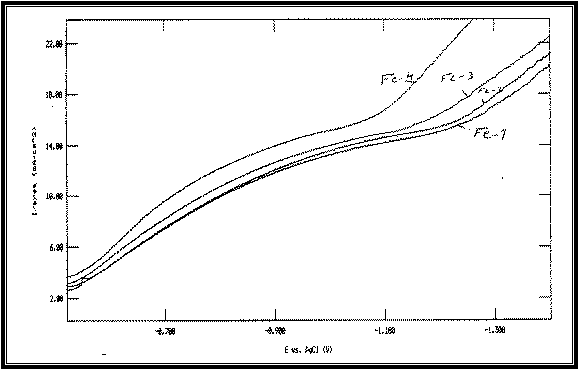 |
Fig 8:
Potentiodynamic cathodic polarization curves of Cu-Fe alloy
electrodeposited from baths with different Iron
concentrations at 23°C and scan
rate of 1 mV s –1 :
Fe-1 at: [Fe]=1 g/l
Fe-2 at: [Fe]=2 g/l
Fe-3 at: [Fe]=5 g/l
Fe-4 at: [Fe]=10 g/l
All at Constant:
[Cu]=25 g/l
[Na]=50 g/l
2. Effect of Coupper:
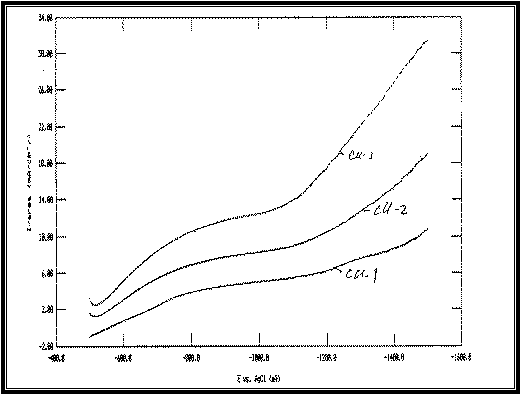 |
Fig 9:
Potentiodynamic cathodic polarization curves of Cu-Fe alloy
electrodeposited from baths with different Copper
concentrations at 23°C and scan
rate of 1 mV s –1 :
Cu-1 at: [Cu]=10 g/l
Cu-2 at: [Cu]=15 g/l
Cu-3 at: [Cu]=20 g/l
All at Constant:
[Fe]=2 g/l
[Na]=50 g/l
3.
Effect of Tri-Sodium
Citrate:
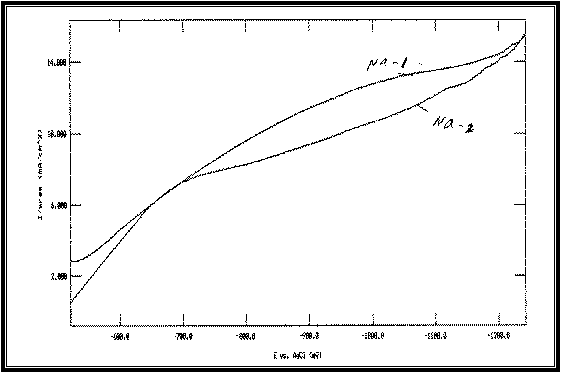 |
Fig 10:
Potentiodynamic cathodic polarization curves of Cu-Fe alloy
electrodeposited from baths with different
Tri-Sodium Citrate concentrations at 23°C and scan
rate of 1 mV s –1 :
Na-1 at: [Na]=20 g/l
Na-2 at: [Na]=70 g/l
All at Constant:
[Fe]=1 g/l
[Cu]=25 g/l
4.
Effect of Iron, Coupper and (Fe-Cu) Alloy:
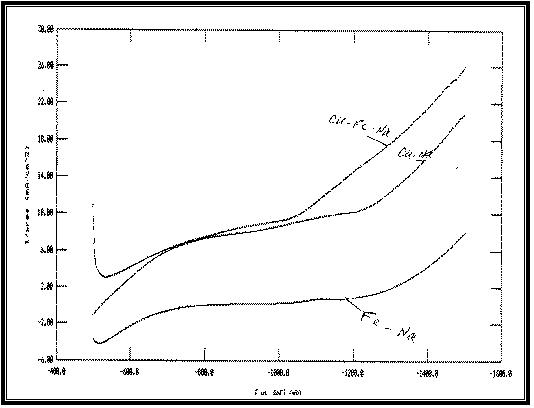
Fig 11:
Potentiodynamic cathodic polarization curves of Cu-Fe alloy
electrodeposited from baths, during electrodeposition of copper and iron as
individual metals and as their binary alloy at 23°C and scan rate of 1 mV s –1
:
•
Cu-Na: individual metal electrodeposited
from bath containing:
[Cu]=20 g/l and [Sodium
Citrate]=50g/l
•
Fe-Na: individual metal electrodeposited
from bath containing:
[Fe]=2 g/l and [Sodium
Citrate]=50g/l
•
Fe-Cu-Na: alloy
electrodeposited
from bath containing:
[Cu]=20 g/l, [Fe]=2 g/l
and [Sodium Citrate]=50g/l
Cathodic
Polarization
Curves Discussion:
Typical potentiodynamic cathodic polarization curves of
Cu, Fe and Cu-Fe deposition under similar conditions arc shown in Figure 11.
It is obvious that the cathodic polarization curve of Cu
lies at less negative potentials than that of Fe indicating that Cu is nobler
than Fe in the present system.
The polarization curve of Cu-Fe alloy lies at more
positive potentials than those of the parent metals. Anomalous codeposition is
observed. Fe, the less noble metal, deposited preferentially.
Figure 8 shows the effect of increasing [Fe]/[Cu]
concentration ratio in the bath on the features of cathodic polarization curves
of the alloy. The data reveal that increasing this concentration ratio shifts
the cathodic polarization curves of Cu-Fe codeposition towards more noble
potentials.
Figure 10 shows the effect of increasing [Cu]/[Fe]
concentration ratio, which give similar result as [Fe]/[Cu].
Increasing [Cu]/[Fe] concentration ratio shifts the cathodic polarization
curves of Cu-Fe codeposition towards more noble potentials.
On the other hand, the polarization curves of Cu-Fe
codeposition shift towards the more negative direction with increasing Sodium
Citrate concentration as shown in Figure 10.
REPORT
SUMMARY
PART
I:
The aim of Electrodeposition of Cu-Fe alloys is to produce highly corrosion
resistant alloy plated steel sheets. The electrodeposition of Cu-Fe alloy is one
of the best known examples of anomaly (irregularity) codeposition, in which the
electrochemically less noble metal (Fe) deposits preferentially.
Sodium Citrate was used as medium of all solutions cells.
Five
different experiments were done to produce the best corrosion
resistant alloy plated steel sheets:
1.
Effect of Copper: [Cu] =
10,25g/l. At constant [Fe] = 2g/l, [Na] = 50g/l.
2.
Effect of Iron: [Fe] = 1,10 g/l. At constant [Cu] = 25g/l, [Na] = 50g/l.
3.
Effect of Tri-Sodium Citrate: [Na]
= 20,70 g/l. At constant [Cu] = 25g/l,
[Fe] = 1g/l.
4.
Effect of Current Density: I=
100,300, 500, 700 mA. At constant [Cu] = 25g/l, [Fe] = 1g/l, [Na] = 70g/l.
5.
Effect of Time: t= 5, 50 min. At constant [Cu] = 25g/l, [Fe] = 1g/l,
[Na] = 70g/l.
The
aim of this technique is to measure the current when applying the potential at
different solutions conditions. When
no external potential is applied to the electrolytic cell, the potentials of the
anode and cathode are equal (no current flow).
Where
as, to produce a current, an external potential must be furnished (this
potential is called polarization).
Four
different experiments were done to study the cathodic polarization curve:
1.
Effect of Fe, Cu and Fe-Cu alloy:
Solution contain: [Cu] = 20g/l, [Fe] = 2g/l, [Na] = 50g/l.
2.
Effect of Cu:
Solutions
contain: Vary [Cu] = 10, 15,20g/l. At constant [Fe] = 2g/l,
[Na] =50g/l.
3.
Effect of Fe:
Solutions
contain: Vary [Fe] = 1,2,5,10g/l.
At constant [Cu] = 25g/l,
[Na] = 50g/l.
4.
Effect of Tri-Sodium Citrate:
Solutions contain:
Vary [Na] = 20, 70 g/l. At constant [Cu] = 25g/l,
[Fe] =1g/l.
CONCLUSION
PART I:
Electrodeposition of
Fe-Cu alloy (Cathodic Current Efficiency):
According to the data, promising solution to be selected as an optimum path for further investigation contains:
25 gL-1 Cupric Acetate and 50 gL-1 Tri-Sodium Citrate and 2 gL-1 Iron, bath (Cu-Fe)-2 and the operating values were T at 23 oC, t = 10 min and I = 100 mA.
For vary the current density and the time, the optimum path:
(Cu-Fe)-10,
which operate at current I=700mA and time t=10min at constant [Cu]=25 gL-1,
[Fe]=2 gL-1 and [Na]=50 gL-1
Percentage Efficiency (F%) increases with increasing the concentration of Sodium Citrate. This indicates that the more acidic bath increase efficiency.
PART
II:
Cathodic
Polarization Curves:
The
cathodic polarization curve of Cu lies at less negative potentials than that of
Fe indicating that Cu is nobler than Fe.
The polarization curve of Cu-Fe alloy lies at more
positive potentials than those of the parent metals. Anomalous codeposition is
observed, Fe the less noble metal, deposited preferentially.
Increasing [Fe]/[Cu] concentration ratio in the bath
shifts the cathodic polarization curves of Cu-Fe codeposition towards more noble
potentials. As the increasing of [Cu]/[Fe] concentration ratio do.
On the other hand, the polarization curves of Cu-Fe codeposition shift
towards the more negative direction with increasing Sodium Citrate
concentration.
REFERNCES
1.
J. Electrochem. Soc., Structure, Composition and Morphology of
Electrodeposited Co Fe Cu Alloy. Vol. 144, No. 10, Oct. 1997.
2.
Al-Betar, A. Some Selected properties of Electroplating. KFUPM, Chemistry
Department.
3.
Al-Garawi, Raid. Electrodeposition of Copper, Iron and Their Binary
Alloy. KFUPM, Chemistry Department.
4.
Khaled, M. and M. Emad. Electroplating of Co Fe Alloys from Aqueous
Acetate Baths. 2000, 41.
5.
M. Emad. Electrodeposition of Metals. Taken in part from the thesis of M.
Emad.
6.
“Electrochemistry,” Microsoft Encarta Encyclopedia. 1993-1996.