| Slide 6 | |
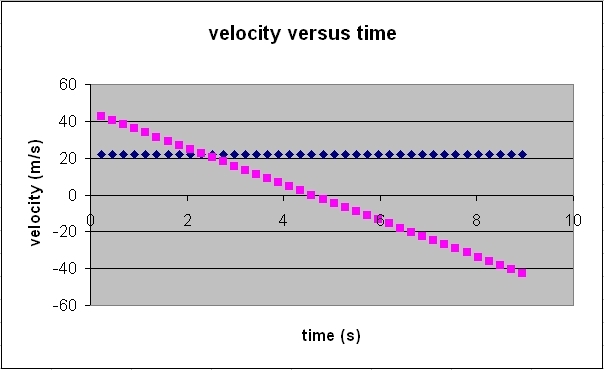
| You now have another chart that displays both vx and vy as function of time t. This time it is better to leave the scaling to Auto. But let's find the best line fit to pink line (vy versus t) using EXCEL, there is obviously no need to fit the blue line (vx versus time); the slope of the blue line is zero, meaning the acceleration ax = 0! | |
 cal2 |
|