| Slide 3 | |
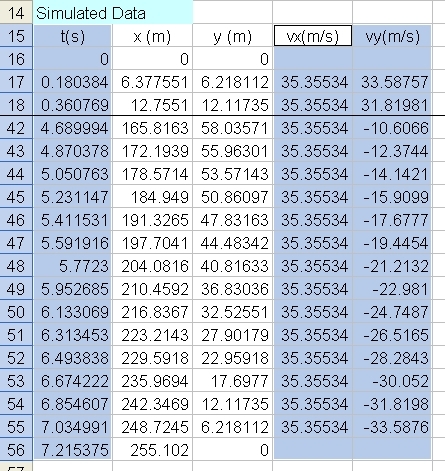
| We are now going to select the three columns of t(s), vx(m/s) and vy(m/s) all together to draw a graph of velocity versus time graph for both x and y components in one chart. Note they are not contiguous, but we still can select them together. First select the t(s) column and scroll up to see the cell D15. Now press the button Ctrl, and select the two columns vx and vy without releasing the Ctrl button (in fact, you can release the Ctrl button soon after you selected the first cell). You will then end up choosing all three non-contiguous columns as seen in the picture below: | |
 cal2 |
|