| Slide 15 | |
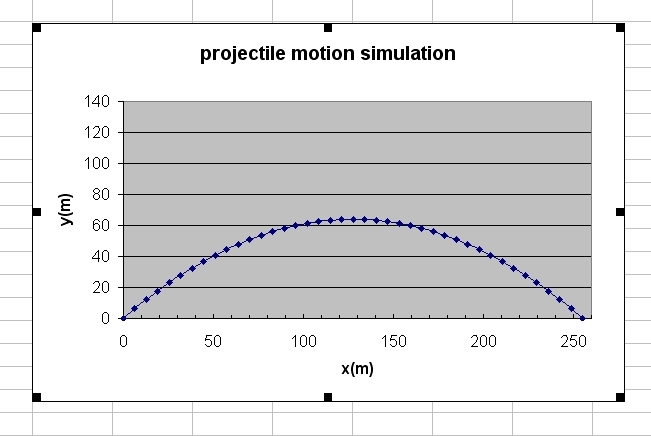
| After the modification of both x and y axis you will end up with a chart like this. Adjust the width of the graph such that 20m in the y axis is more or less equal to 20m in the x-axis. This way you will have a situation where this graph truly represent the real situation of a projectile motion (the shape of the trajectory becomes a true (undistorted) parabola). | |
 cal2 |
|