| Slide 9 | |
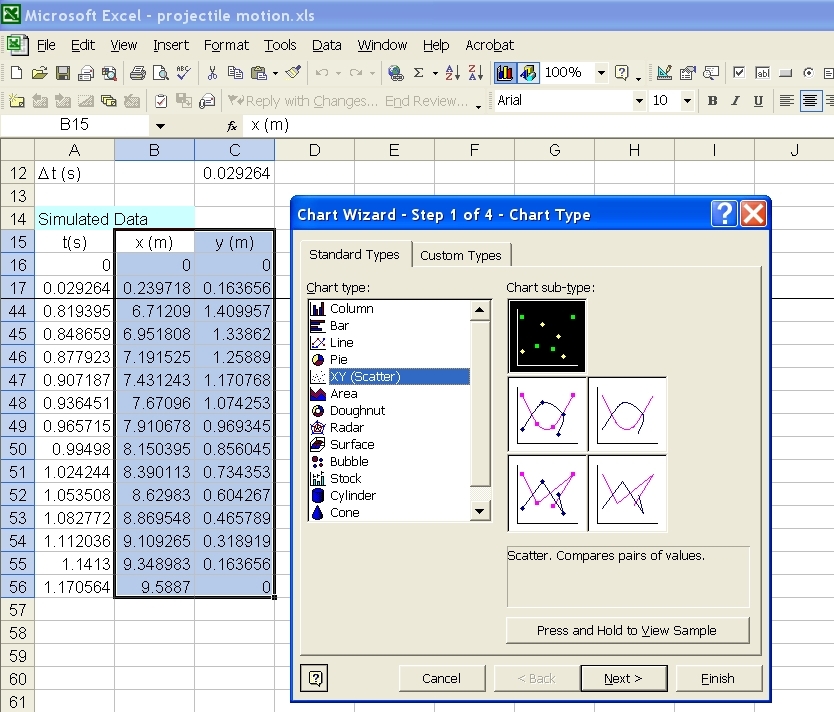
| Now select all the cells from B15 to C56, the x and y columns we are going to plot. Go to insert --> Chart to invoke the chart wizard (alternatively you can click on the chart wizard button in the tool bar). | |
 cal2 |
|
| Slide 9 | |
| Now select all the cells from B15 to C56, the x and y columns we are going to plot. Go to insert --> Chart to invoke the chart wizard (alternatively you can click on the chart wizard button in the tool bar). | |
|
cal2 |
|