| Slide 7 | |
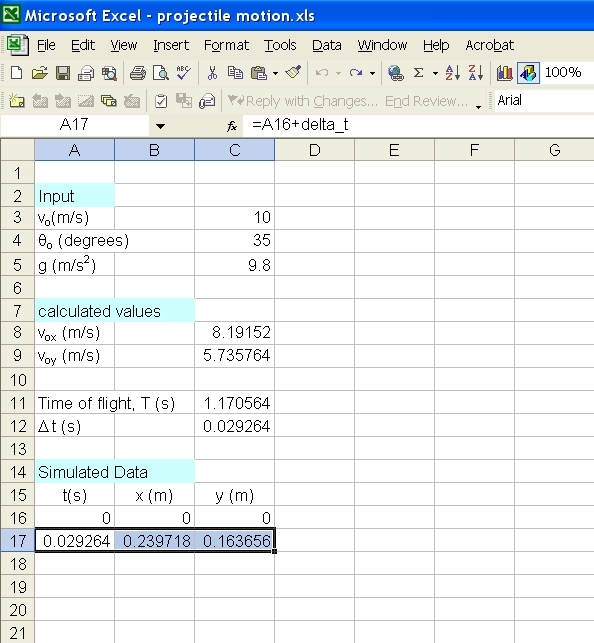
| Highlight the three cells A17, B17 and C17 in row 17, and bring the cursor to bottom right corner of cell C17; the cursor changes its shape to a plus sign. Drag the cursor all the way to the row 56 (16+40) to fill down the formulas. This ensures we have 40 data points to draw a graph. If you look at the data at the 56th row you will see that the value of t is equal to the time of flight T and the y value is equal to zero again; the projectile has come back to the same vertical level it started with. The x value at the 40th point should give the horizontal range of the projectile. | |
 cal2 |
|