CHAPTER
FIVE
Sampling Distributions
In
this chapter we will introduce one of the most important concepts in
statistics, that of the sampling distribution.
Example
5.1: A population consisting of exam
grades of N = 5 students taking the Engineering Statistics course is
described below
Table 1
Distribution of Grades for the Engineering Statistics Class
|
Name |
Ordinal Grade |
Grade Points |
|
Mohammad Abdallah Khaled Ali Saad |
B C B A C |
3 2 3 4 2 |
It is easy to check that for
grade points (![]() ), the mean and variance are given by
), the mean and variance are given by
![]()

Now
consider a sample of size 2, and prepare all possible samples without
replacement. In fact, there will be ![]()
![]() samples without
replacement. The sample means and the corresponding probabilities are tabulated
below:
samples without
replacement. The sample means and the corresponding probabilities are tabulated
below:
Table 2 All Possible Samples
of Size 2 with their Probabilities
|
|
Sample Units |
P( |
|
2.0 |
(Abdallah, Saad) |
0.10 |
|
2.5 |
(Mohammad, Abdallah),
(Mohammad, Saad) (Abdallah, Khaled),
(Khaled, Saad) |
0.40 |
|
3.0 |
(Mohammad, Khaled),
(Abdallah, Ali), (Ali, Saad) |
0.30 |
|
3.5 |
(Mohammad, Ali), (Khaled, Ali) |
0.20 |
The expected value of the sample mean is
![]()
which is the same as the population mean ![]() . The expected value of
. The expected value of
![]() is given by
is given by
![]()
so that ![]() .
.
It may be shown that
![]()
That is the variance of the sample mean ![]() can be calculated from
the population variance
can be calculated from
the population variance ![]() . Note that in case of sampling with replacement with large
. Note that in case of sampling with replacement with large ![]() , we have
, we have ![]() and consequently,
and consequently, ![]() .
.
5.1 Sampling
Distributions of Sums and Means and the Central Limit Theorem
Example 5.2 One hundred bolts are packed
in a plastic box. The weight of the empty box can be ignored. However, each bolt weighs around 1 ounce with
standard deviation s = 0.01 ounce. Assume that
weights of bolts follow a normal distribution.
(a) Find the
probability that a box filled with hundred bolts weighs more than 100.196
ounces.
(b) Find the probability that the mean weight of 100
bolts is more than 1.00196 ounces.
Solution
(a) ![]()
 .
.
(b) Since
 ,
,
![]() .
.
Note that the events in (a) and (b) are equivalent.
Example 5.3 The weights
of ball bearings have a distribution with a mean of 22.40 ounces and a standard
deviation of 0.048 ounces. If a random sample of size 36 is drawn from this
population, find the probability that the sample mean lies between 22.39 and
22.42.
Solution Let X =
weight of a ball bearing. Then
![]()
and

and hence
![]() .
.
5.2
The
Let X be a binomial random variable with ![]() trials and success
probability p. Then probabilities of events related to X can be
approximated by a normal distribution with mean
trials and success
probability p. Then probabilities of events related to X can be
approximated by a normal distribution with mean ![]() and variance
and variance ![]() if the conditions
if the conditions ![]() and
and ![]() are satisfied.
are satisfied.
Continuity
Correction
It is the adjustment made to an integer-valued
discrete random variable when it is approximated by a continuous random
variable. For a binomial random
variable, we inflate the events by adding or subtracting 0.5 to the event as
follows:
![]()
![]()
![]()
![]()
![]() .
.
The
continuity correction should be applied anytime a discrete random variable is
being approximated by a continuous random variable.
Example 5.4 The pass
mark in an examination is the median mark.
A random sample of 10 candidates is chosen after the examination.
(a) What is the
distribution of the random variable “the number of students who passed the
examination”?
(b) Find the
probability that more than 2 of the selected candidates passed the examination.
(c) Find the
probability that at least 2 of the selected candidates passed the examination.
(d) Solve parts
(b) and (c) using the normal approximation.
Solution
(a) Any candidate
picked either passes or fails the examination (i.e. mutually exclusive outcomes
at each trial). Since the pass mark is
the median mark, it means that 50% of the candidates passed the examination so
that ![]() The trials are assumed
to be independent. Thus, the random variable “the number of students who passed
the examination” is a binomial random variable with n = 10 and p = 0.5.
The trials are assumed
to be independent. Thus, the random variable “the number of students who passed
the examination” is a binomial random variable with n = 10 and p = 0.5.
(b) If we
represent the random variable in (a) by X, then we are interested in the
probability ![]() . By the use of
binomial probability we have
. By the use of
binomial probability we have
![]()
![]()
whereas
by using Statistica we have:
![]() .
.
(c) By the use
of binomial probability we have
![]()
![]()
whereas
by using Statistica we have:
![]() .
.
(d) Since![]() , we use the normal approximation to binomial and so the
random variable X has a normal distribution with mean
, we use the normal approximation to binomial and so the
random variable X has a normal distribution with mean ![]() and variance
and variance ![]() So to solve the
problems based on the approximation, open the Normal Probability
Calculator, put 5 for the mean and
So to solve the
problems based on the approximation, open the Normal Probability
Calculator, put 5 for the mean and ![]() for the standard
deviation.
for the standard
deviation.
For the problem in part (b),
we have
![]()
For the problem in part (c),
we have
![]()
5.3 Drawing a Random Sample from a known
Distribution
Random samples are drawn from a
known distribution by evaluating the inverse cumulative distribution functions
at random probabilities. For example,
suppose a random variable has a cumulative distribution function F,
i,e, ![]() , where x is a value in the domain
of X, and hence
, where x is a value in the domain
of X, and hence ![]() . Thus by supplying
random values between 0 and 1 for p,
we obtain values of x, which
constitute a random sample from the distribution with cumulative distribution
function F.
. Thus by supplying
random values between 0 and 1 for p,
we obtain values of x, which
constitute a random sample from the distribution with cumulative distribution
function F.
The V-functions and Rnd
function
In Statistica, the V-functions are the inverse
cumulative distribution functions and can be found in the Function
Wizard. There is VNormal for the normal
distribution, VExpon for the exponential distribution, and so on.
Another function in the Function Wizard is the Rnd(x)
function, which gives random numbers between 0 and x. For example, Rnd(1) gives a
random number between 0 and 1, which can be used to represent random
probability values.
Sampling from the Normal Distribution
The inverse cumulative
distribution function of the normal distribution is ![]() where x is a probability value, mu is the mean
of the normal distribution and sigma is its standard deviation. To draw a random sample from the normal
distribution with mean 60 and variance 25, we summarize the steps below:
where x is a probability value, mu is the mean
of the normal distribution and sigma is its standard deviation. To draw a random sample from the normal
distribution with mean 60 and variance 25, we summarize the steps below:
1.
Double-click VAR1
2.
Type =Rnd(1) in the
formula box
3.
OK/Yes
4.
Double-click VAR2
5.
Type the equal sign “=” in the
formula box
6.
Functions/Distributions,
Double-click VNormal
7.
x = v1, mu = 60 and sigma = 5
8.
OK/Yes.
The values given in VAR2
constitute the required sample. Alternatively, we can obtain the sample without
using two columns of our data sheet. For
example, if we wish to have our sample in VAR3, we will proceed as follows:
1.
Double-click VAR3
2.
Type the equal sign “=” in the
formula box
3.
Functions/Distribution, Double-click
VNormal
4.
x = Rnd(1), mu = 60 and sigma = 5
5.
OK/Yes.
Sampling from the Exponential
Distribution
The inverse cumulative
distribution function of the exponential distribution is VExpon(x, lambda), where x is a probability value and lambda is the parameter of the
exponential distribution. Care must be
taken when supplying the value for lambda. For example, if we are sampling from an
exponential distribution with parameter k,
we directly substitute k for lambda.
On the other hand, if we are sampling from an exponential distribution with
mean k, we
substitute 1/k for lambda. To draw a sample from the exponential with
parameter 0.5, follow the steps:
1.
Double-click VAR1
2.
Type = Rnd(1) in the
formula box
3.
OK/Yes
4.
Double-click VAR2
5.
Type the equal sign “=” in the
formula box
6.
Functions/Distributions,
Double-click VExpon
7.
x = v1, lambda = 0.5
8.
OK/Yes.
Here, we can also draw the random
sample using only one column of our data sheet as follows:
1.
Double-click VAR3
2.
Type the equal sign “=” in the
formula box
3.
Functions/Distributions,
Double-click VExopn
4.
x = Rnd(1), lambda = 0.5
5.
OK/Yes.
100 random samples each of size
30 are drawn from the exponential distribution with mean ![]() ; their means are tabulated below:
; their means are tabulated below:
Table
3 Means of 100 Random Samples of Size 30 from the ExponentialDistribution
|
Sample |
|
Sample |
|
Sample |
|
Sample |
|
|
1 |
2.184054 |
26 |
2.082070 |
51 |
2.282192 |
76 |
1.783575 |
|
2 |
1.814839 |
27 |
1.445744 |
52 |
1.504987 |
77 |
1.587805 |
|
3 |
1.845744 |
28 |
1.758239 |
53 |
2.398457 |
78 |
2.620010 |
|
4 |
2.204828 |
29 |
1.997465 |
54 |
2.227194 |
79 |
1.679762 |
|
5 |
2.556562 |
30 |
1.758824 |
55 |
2.314496 |
80 |
1.274267 |
|
6 |
1.931955 |
31 |
1.850869 |
56 |
1.866983 |
81 |
2.160579 |
|
7 |
2.179001 |
32 |
1.393448 |
57 |
1.697291 |
82 |
1.310457 |
|
8 |
1.977819 |
33 |
1.849390 |
58 |
1.483425 |
83 |
2.149534 |
|
9 |
2.580562 |
34 |
1.806390 |
59 |
2.121959 |
84 |
2.210060 |
|
10 |
2.116091 |
35 |
2.342794 |
60 |
2.005428 |
85 |
2.403257 |
|
11 |
1.992988 |
36 |
1.872477 |
61 |
2.249343 |
86 |
1.801674 |
|
12 |
2.321373 |
37 |
1.948877 |
62 |
1.733591 |
87 |
1.759119 |
|
13 |
2.037973 |
38 |
1.829172 |
63 |
1.718578 |
88 |
2.018302 |
|
14 |
2.437841 |
39 |
1.457925 |
64 |
1.296010 |
89 |
1.549417 |
|
15 |
2.149032 |
40 |
2.142974 |
65 |
2.332216 |
90 |
2.446048 |
|
16 |
1.758222 |
41 |
2.096374 |
66 |
1.944724 |
91 |
1.754672 |
|
17 |
1.756615 |
42 |
1.900634 |
67 |
2.360446 |
92 |
1.968279 |
|
18 |
2.027894 |
43 |
2.054499 |
68 |
2.815900 |
93 |
1.729697 |
|
19 |
2.010520 |
44 |
2.077696 |
69 |
2.436328 |
94 |
1.959883 |
|
20 |
1.877407 |
45 |
2.126649 |
70 |
2.168109 |
95 |
2.062244 |
|
21 |
1.711968 |
46 |
2.091533 |
71 |
1.683284 |
96 |
1.808607 |
|
22 |
1.823209 |
47 |
2.304099 |
72 |
2.290407 |
97 |
1.378574 |
|
23 |
2.750169 |
48 |
1.565620 |
73 |
1.601436 |
98 |
1.950490 |
|
24 |
2.146609 |
49 |
2.700095 |
74 |
1.694431 |
99 |
1.888556 |
|
25 |
1.933193 |
50 |
2.321632 |
75 |
2.279583 |
100 |
2.009424 |
One hundred means given in Table 3
have been used to draw a histogram (See Figure 5.1) which is approximately bell
shaped. The larger the sample sizes, the better would be the approximation
towards normal frequency curve.
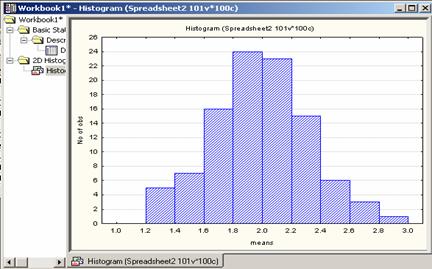
Figure
5.1 Histogram of the sample in Table 3
5.4
Use of t ,![]() and F Tables
and F Tables
Using
the student t table in Appendix A3 we can find the following:
For
a t random variable with 8 degrees of freedom, P(t > 2.896) =
0.01
For
a t random variable with 17 degrees of freedom, P (t < –2.898)
= 0.005
For
a t random variable with 21 degrees of freedom, P (t < –1.721)
= 0.05
Using
the ![]() table in Appendix A4 we
can find the following:
table in Appendix A4 we
can find the following:
For
a ![]() random variable with 7 degrees of freedom, P(
random variable with 7 degrees of freedom, P(![]() > 2.17) = 0.95
> 2.17) = 0.95
For
a ![]() random variable with 17 degrees of freedom, P(
random variable with 17 degrees of freedom, P(![]() < 33.41) = 0.99
< 33.41) = 0.99
For
a ![]() random variable with 28 degrees of freedom, P(
random variable with 28 degrees of freedom, P(![]() > 48.28) = 0.01
> 48.28) = 0.01
Using
the F table in Appendix A5 we can find the following:
For
an F random variable with 4 and 7 degrees of freedom, P(F >
4.12) = 0.05
For
an F random variable with 15 and 21 degrees of freedom, P(F >
2.534) = 0.025
For
an F random variable with 12 and 9 degrees of freedom, P(F >
5.111) = 0.01
5.5 The Probability
Calculator for t, ![]() and F Distributions
and F Distributions
The t Probability Calculator
In the Probability Distribution Calculator,
select t (Student) for the ![]() -distribution (see Figure 5.2) and supply the Degrees
of Freedom (df).
-distribution (see Figure 5.2) and supply the Degrees
of Freedom (df).
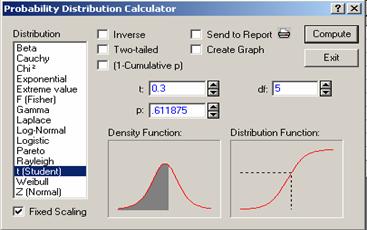
Figure 5.2 Probability Calculator for the
t-distribution
It is important to note that the t
random variable is symmetric about zero regardless of the value of the df.
Figure
5.2 shows that for the t random
variable with 5 df, the
probability that t is
less than 0.3 is 0.611875, i.e., ![]() , where
, where ![]() has a Student t-distribution with 5 degrees of freedom. The Two-tailed and (1-Cumulative
p) probabilities and their
combinations are computed in the same way as done for standard normal random
variable.
has a Student t-distribution with 5 degrees of freedom. The Two-tailed and (1-Cumulative
p) probabilities and their
combinations are computed in the same way as done for standard normal random
variable.
The
value ![]() is the value of t
random variable for a given df
that has an area (or a probability) of
is the value of t
random variable for a given df
that has an area (or a probability) of ![]() to its right. The value
to its right. The value
![]() is similarly
defined.
is similarly
defined.
The
Chi-Square Probability
Calculator
Selecting
Chi2 under Probability
Distribution Calculator gives the calculator for chi-square random variable.
Just as in the case of t-distribution, the parameter to be supplied here is the df.
However, the Two-tailed on this calculator is disabled and cannot be
used. The (1-Cumulative
p) and the Inverse function are used the same way as done for the
normal distribution.
The
F Probability
Calculator
To get the probability calculator for the F distribution,
we select F from the list of distributions. Here, we are required to supply two
parameters; the first and the second df (df1 and df2) respectively.
Figure 5.3 shows that for F distribution with 3 and 20 df, the 95th
percentile is 3.098389.
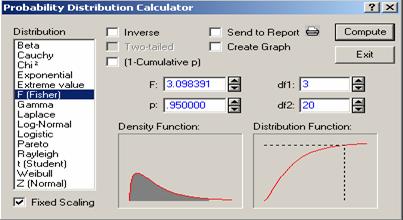
Figure 5.3 Probability Calculator for the F
distribution
Note
that the Two-tailed on this
calculator is disabled and cannot be used.
Exercises
5.1 (Johnson, R. A., 2000, 212). A random
sample of size 100 is taken from an infinite population having a mean, 76 and a
variance, 256. What is the probability that the sample mean will be between 75
and 78?
5.2 (Johnson, R. A., 2000, 212). A wire-
bonding process is said to be in control if the mean pull-strength is 10
pounds. It is known that the pull-strength measurements are normally
distributed with a standard deviation of 1.5 pounds. Periodic random samples of
size 4 are taken from this process and the process is said to be “out of
control” if a sample mean is less than 7.75 pounds. Comment.
5.3 The weights of ball bearings have a distribution with a mean of
22.40 ounces and a standard deviation of 0.048 ounces. If a random sample of
size 49 is drawn from this population, find the probability that the
(a) sample mean lies between 22.36 and
22.41,
(b) sample mean is more than 22.38,
(c) sample mean is no more than 22.43,
(d) sample mean is greater than or equal to
22.41.
5.4 Suppose
X is normally distributed with mean 50 and variance 9. Let ![]() be a random variable
in the sense of drawing repeated samples of size 16 from the distribution of X.
Find the probability that
be a random variable
in the sense of drawing repeated samples of size 16 from the distribution of X.
Find the probability that
(a) ![]() differs from the mean
by less than 2.5 units,
differs from the mean
by less than 2.5 units,
(b) ![]() differs from the mean
by more than 1.5 units,
differs from the mean
by more than 1.5 units,
(c) ![]() is between 1.8 and
2.6.
is between 1.8 and
2.6.
5.5 Consider
a binomial random variable with 50 trials and success probability 0.39.
(a) Compute the probability that it is at
least equal to 15.
(b) Compute the probability that it is at
most equal to 12.
(c) Compute the probability that it is equal
to 20.
(d) Compute the probability that it is equal
to 30.
(e) Repeat (a) to (d) using the normal
approximation to the binomial.
5.6 Consider
a binomial random variable with 100 trials and success probability 0.45.
(a) Compute the probability that it is at
least equal to 25.
(b) Compute the probability that it is at
most equal to 32.
(c) Compute the probability that it is less
than or equal to 20.
(d) Compute the probability that it is equal
to 40.
(e) Repeat (a) to (d) using the normal
approximation to the binomial.
5.7 Draw a
random sample of size 200 from a normal distribution with mean 40 and variance
36. Compute the mean and standard deviation of your sample.
5.8 Draw a
random sample of size 60 from a normal distribution with mean 10 and variance
4. Compute the mean and standard deviation of your sample.
5.9 Draw a
random sample of size 100 from a normal distribution with mean 20 and variance
25. Compute the mean and standard deviation of your sample.
5.10 Draw a
random sample of size 100 from an exponential distribution with λ =
4. Compute the mean and standard
deviation of your sample.
5.11 Draw a
random sample of size 120 from an exponential distribution with mean 2. Compute
the mean and standard deviation of your sample.
5.12 Suppose X
is normally distributed with mean 60 and variance 16. Find the probability that
![]() based on samples of
size 9, differs from the mean by less than 2.5 units.
based on samples of
size 9, differs from the mean by less than 2.5 units.
5.13 Consider
a binomial random variable with 20 trials and success probability 0.45.
(a) Compute the probability
that it is at least equal to 3.
(b) Compute the probability
that it is at most equal to 12.
(c) Compute the probability
that it is equal to 3.
(d) Compute the probability that it is
equal to 12.
(e) Repeat (a) to (d) using the normal
approximation to binomial.
5.14 Draw a random sample of size 36 from a
normal distribution with mean 10 and variance 4. Compute the mean and standard
deviation of your sample.
5.15 Consider
an exponential distribution with expected value 10. Draw ![]() samples of size
samples of size ![]() from the above
population. Draw a relative frequency histogram and relative frequency curve
for the 100 sample means. Repeat the experiment with
from the above
population. Draw a relative frequency histogram and relative frequency curve
for the 100 sample means. Repeat the experiment with ![]() samples of size
samples of size ![]() . What is the sampling distribution of the sample means?
. What is the sampling distribution of the sample means?
5.16 Consider
the t random variable with 10 df.
(a) Find
the proportion of the area to the right of 2.1.
(b) Find
the probability that ![]() is less than 2.
is less than 2.
(c) Find
the proportion of the area to the left of –2.1.
(d) Find
the proportion of the area between –2.1 and +2.1.
(e) Find
the proportion of the area between –1.2 and +2.1.
5.17
Consider a ![]() random variable with 9
degrees of freedom.
random variable with 9
degrees of freedom.
Find ![]() .
.
5.18 Complete the table for t random
variable with 19 df. Note that the relationship between ![]() and
and ![]() is:
is: ![]()
|
|
|
|
|
|
|
0.01 |
|
2.539488 |
|
|
|
0.02 |
|
|
|
|
|
0.05 |
|
|
|
|
|
.010 |
|
|
1.729133 |
|
|
0.02 |
|
|
|
|
5.19 Consider the chi-square random variable
with 25 degree of freedom.
(a) Find
the probability that it is less than 20.
(b) Find
the probability that it is greater than 25.
(c) Find
the probability that it is between 21and 24.
5.20
Consider
a ![]() random variable with
32 degrees of freedom.
random variable with
32 degrees of freedom.
Find ![]() .
.
5.21
Consider
a ![]() random variable with 119 degrees of freedom.
random variable with 119 degrees of freedom.
Find ![]() and compare them with
and compare them with
![]() .
.
5.22
Consider
a ![]() random variable with 9 degrees of freedom.
random variable with 9 degrees of freedom.
Find ![]() .
.
5.23
Consider
an F random variable with 3 and 4 degrees of freedom.
Find ![]() .
.