
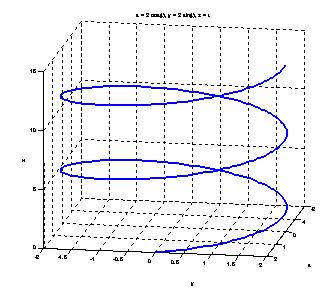
•ezplot3('2*cos(t)','2*sin(t)','t',[0,9*pi/2])
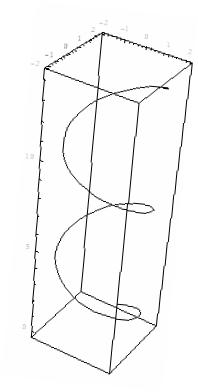
•ParametricPlot3D[{2
Sin[t],2 Cos[t],t},{t,0,9
Pi/2}]
| Sec 9.1 | |
| power point slides | |
|
|
|
•ezplot3('2*cos(t)','2*sin(t)','t',[0,9*pi/2])
|
•ParametricPlot3D[{2
Sin[t],2 Cos[t],t},{t,0,9
Pi/2}]
|
|
|
|
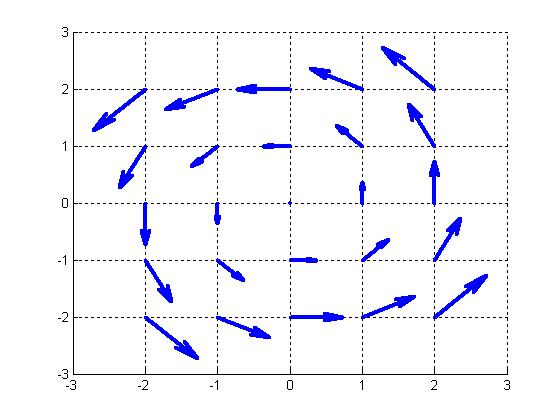
| Sec 9.5 Gradient |
| Power point |
|
|
<< Calculus`VectorAnalysis` SetCoordinates[Cartesian[x, y, z]] Grad[x^2 Sin[x y]] |
|
DotProduct[{1.2, 1.1, 0}, {5.4, -2, 1.2}] |
| Sec 9.7 | |
| Power point | |
| MATLAB | |
|
|
 |
|
|
|
| Sec 9.8 |
| Power point |
| Sec 9.9 |
| Power point |
| Sec 9.12 |
| Power point |
| Sec 9.13 |
| Power point |
| Sec 9.14 |
| Power point |
| Sec 9.16 |
| Power point |
| Sec 4.1 |
| Power point |
| Sec 4.2 |
| Power point |
| Sec 4.3 + Sec 4.4 |
| Power point |
| Sec 4.5 |
| Power point |
| Sec 12.2 |
| Power point |
| Sec 12.5 |
| Power point |
| Sec 13.4 |
| Power point |
| Sec 15.3 |
| Power point |
| Legendre |
| Power point |